
Using AI to count all the solar panels in the world
| Suzanne Atkins |
Artificial Intelligence
Research

One photovoltaic solar energy generating unit, two photovoltaic solar energy generating units…
Solar power generation is one option for decarbonising electricity production. However, if we don’t know how many solar panels there are in the world and where they are, we’re missing a piece of information about how well we are doing with with regard to the Paris Climate Agreement or the UN Sustainable Development Goals. Policy makers cannot design or test their renewable energy plans, or check for unwanted side effects such as loss of habitat or productive farmland. However, many existing inventories of solar power facilities focus on a single region, provide only aggregated statistics without geographical information or are not publicly available.
In a recent paper published in Nature, Lucas Kruitwagen from the University of Oxford and his team presented a publicly available new data set of global commercial scale solar energy capacity. They did this by training a machine learning algorithm to identify industrial solar facilities in satellite images from the European Space Agency’s Sentinel-2 satellites and SPOT, owned by Airbus. They found 68,661 facilities, which is a massive increase of 432% on previous catalogues.
…three photovoltaic solar energy generating units, four photovoltaic solar energy generating units…
Counting solar panels in satellite images with a machine learning algorithm sounds simple, right? The absolute perfect, logical application of machine learning algorithms. They’re rectangular, black, immobile and are installed in places without cloud cover or trees. Counting them by hand would be a complete pain so automation makes sense. However, like every machine learning problem ever tried, there’s a lot more to it than that.
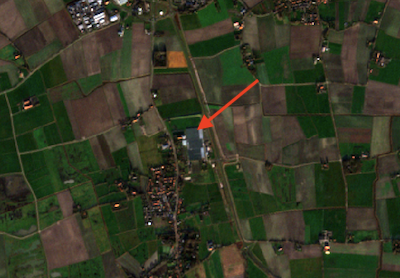
The research team couldn’t just throw a bunch of satellite photos at a machine learning algorithm. Even industrial solar panels are relatively small. Open source Sentinel-2 satellites produce images with resolution of 10x10m, compared with the higher resolution commercial 4 band SPOT satellites (1.5×1.5m). The problem is that solar panels look like a lot of other smallish flat grey things in a 10x10m resolution photo: greenhouses, carparks, the list goes on. The 3 Sentinel-2 satellite images below show Dutch solar panel installations in South Holland, followed by three images of other manmade structures. If you search the coordinates of the Dutch solar farms in the Sentinel-2 images below in Google Maps, you can see individual units because the resolution is much higher.
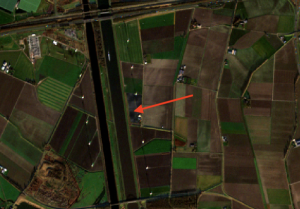
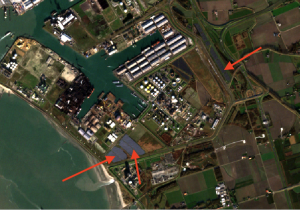
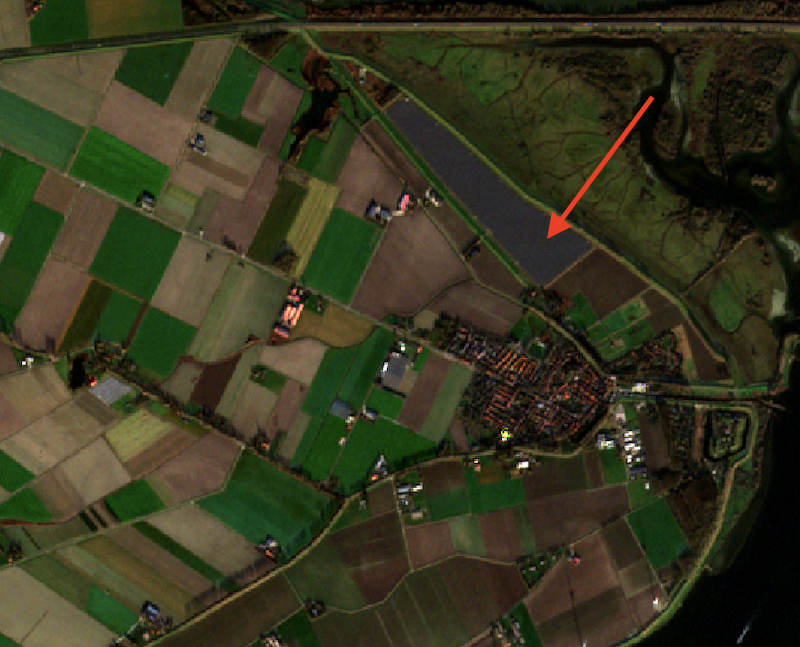
Dutch solar farms at Völckerdorp (left, 51.415, 4.240), Vlissingen-Oost (centre, 51.437, 3.718) and Ooltgensplaat (right, 51.692, 4.345) in Sentinel-2 RGB images. (Copernicus Sentinel-2, 2021-12-21, retrieved from Copernicus Open Access Hub)
Unlike higher resolution commercial satellite imagery, the Sentinel-2 data are freely available and cover the entire planet with regular passes since 2015. They can therefore be used for time-series analysis. The Sentinel-2 satellites are also broader band with 12 channels, picking up tell-tale absorption patterns from solar panels.
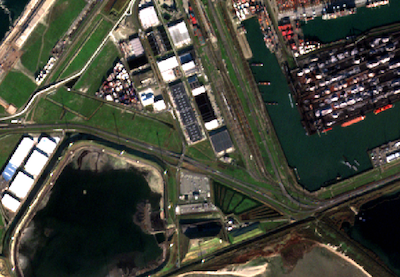

Three man-made structures that are not large scale solar panel installations: warehouses at Maasvlakte (left), greenhouses near Sint Laurens (centre), and a wholesale florist with solar panels on the roof near Elsbroek (right). (Images from Copernicus Sentinel-2, 2021-12-21, retrieved from Copernicus Open Access Hub)
…five photovoltaic solar energy generating units, six photovoltaic solar energy generating units…
Although labelled satellite image databases do exist, such as Open Street Map, there was none of sufficient size or quality for this project. The research team had to manually count installations in order to make a training set for their networks. Thankfully, they only had to do this once, and they have made their training sets openly available for future use. That means that any future study will be spared the pain of picking out solar panels. They have also made their inventory of solar installations publicly available for researchers and policy makers.
The team used a custom convolutional neural network with U-net architecture to identify solar panels from these images, followed by a recursive neural network to find the construction date using images of the same area captured at different times. Their Tensorflow code is available on Github.
The concept of this study was pretty simple. However, it highlights many of the problems of large scale data analysis. Many hours of manual work were required to generate the training set, even when polygons from Open Street Map were used. This was because of inconsistencies in the OSM database and because negative examples were needed. Further manual verification of the final results was also required, making the study very labour intensive for an automatic process.
The catalogue released in 2021 is also already out of date because it used images captured between 2016 and 2018. The processing cost around a million CPU hours and 20,000 GPU hours, which was 2 months clock time. Whilst significantly cheaper and faster than identifying solar panels manually, it is neither particularly quick nor cheap! However, interested parties could quickly rerun the process focussing on particular regions rather than the entire planet.
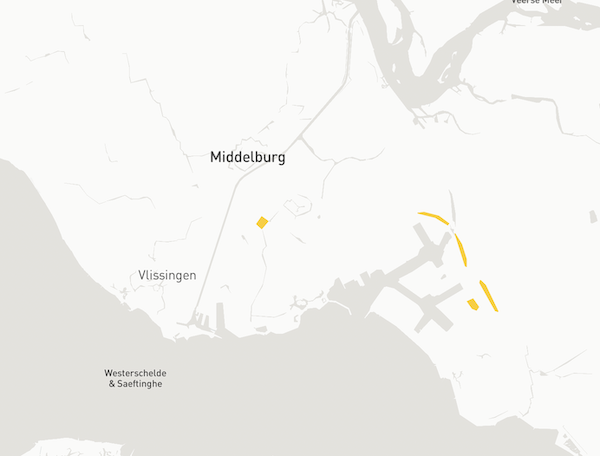
Solar panels around Vlissingen identified in this study (yellow). Compare with the image from 2021 (middle image in first set) and it is already clear that the data set is missing installations. Visualisation from ResourceWatch.org
…sixty eight thousand, six hundred and sixty one photovoltaic solar energy generating units…
The new catalogue offers a massive improvement on previous inventories. Previous asset level inventories provide a more accurate estimation of production capacity at an individual installation level because they include important details such as the installation angle and type of panel used. However, since these inventories missed 3/4 of the global installations, the asset level details are of second order importance.
The training set is only valid for commercial solar installations with between 10kW and 1MW capacity. If future researchers want to make a catalogue of other types of photovoltaic unit, for example domestic installations or new technologies with different absorption patterns, they will have to repeat the process. This will require the use of higher resolution commercial satellite data.
Image: Red Zeppelin via Unsplash.com
Dr. Suzanne Atkins is a geophysics researcher and was consultant at ICT Institute from 2021-2022. She is now working at TNO as machine learning expert in Geophysics.