
Effective learning analytics for higher education
| Sieuwert van Otterloo |
Artificial Intelligence
Most universities use online learning platforms, either to support in-person classes or as the main channel for communication with students. These platforms collect data and statistics that could be used to optimize the learning process: The term ‘learning analytics’ was introduced in 2011 to denote this promising use of learning data. Despite its promises, learning analytics is underused in Dutch universities and higher education institutions. Daryl Zandvliet decided to investigate how learning analytics can be used more effectively in his thesis “Towards effective learning analytics for higher education: returning meaningful dashboards to teachers”.
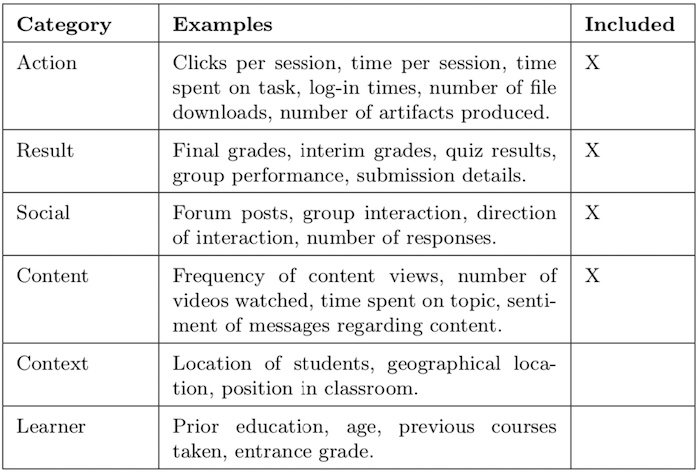
Examples of learning analytics data
The data that is used in learning analytics can be any available data that could be helpful for optimising the learning process. This data is collected and compared in visual dashboard, that are designed for teachers or other professionals. Many different dashboard designs have been proposed, with many different indicators. These indicators can be categorised in six categories: action, result, social, content, context and student. The table below shows examples in each category.
Research approach
Many learning analytics proponents argue that the benefits of using all this data are huge. It is therefore surprising that learning analytics is not universally used in higher education. Daryl Zandvliet had conducted a survey among higher education staff about learning analytics. The survey goals were to understand to what extend learning analytics is used, which elements are used, how it is used and what would be needed to make better use of learning analytics.
The first part of the. survey contained the following topics:
- Usage of LMS statistics after the course is finished
- Usage of LMS statistics during the course
- Usage of other types of analytics for teaching purposes
- Interim tests during the course
- Quizzes during the course
- Approaching students based on data from the LMS
The second part of the survey consisted of showing teachers elements of existing learning analytics dashboards, and ask for feedback on the design. Finally, some general questions about the willingness to use dashboards were included in the survey.
Survey results
It is interesting that teachers make different use of tests in the middle of courses (‘midterms’) and quizzes. Such tools generate useful data about the learning process during the courses, but they do take time away from the actual lectures. As the chart shown below shows, midterms are not universally used. Many courses only have one test moment at the end:

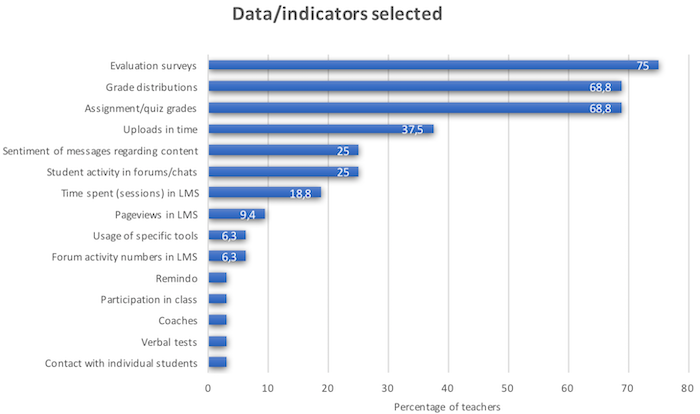
There is a lot more agreement among teachers on what indicators are most useful. The following chart shows what type of data teachers are currently using the most”. “Evaluation surveys, grade distributions and quiz grades are most commonly used, more often than typical Learning Analytics data, such as time spent in an online learning platform or pageviews. The second part of the survey results shows teachers believe more action, result and content related indicators are useful for understanding student performance and context.
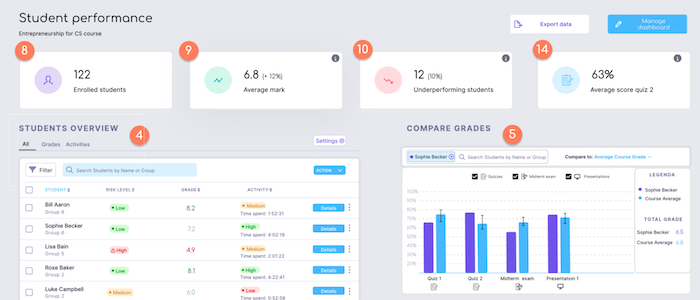
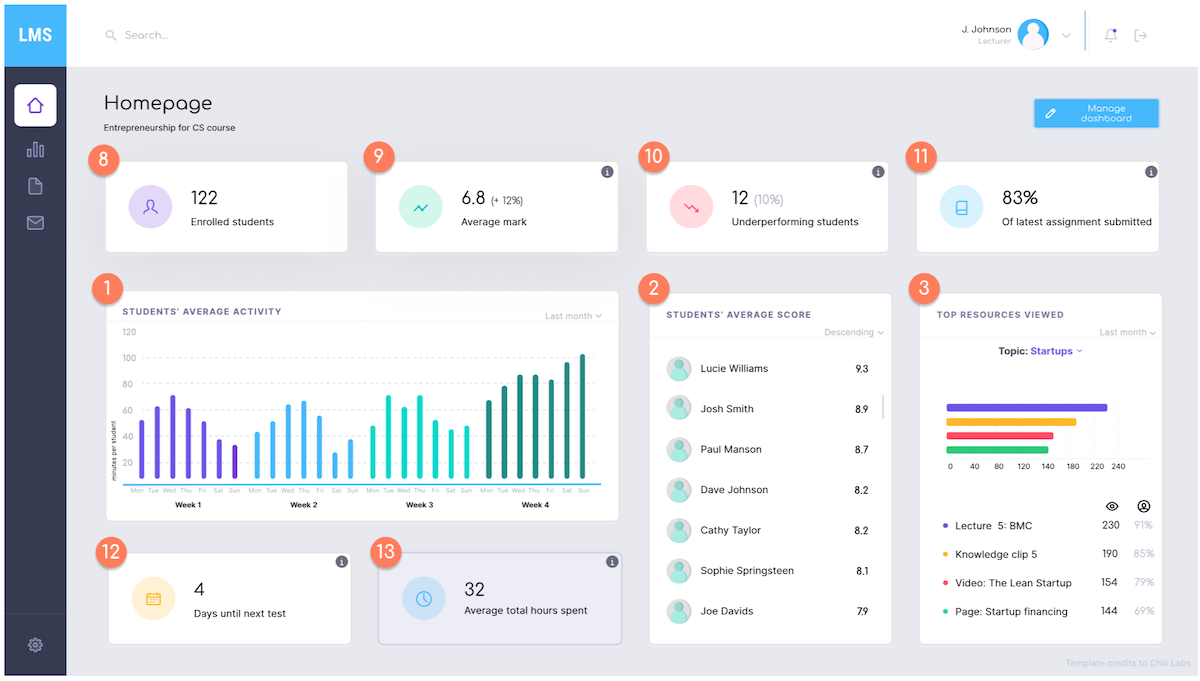
New dashboard design
One of the most interesting aspects of Daryl Zandvliet’s thesis is that he summarised his survey findings in a new dashboard design. The illustration on top as well as the illustration below show the new dashboards. The design are deliberately action-oriented: they show the key figures, but also outliers that a teacher may want to approach. The full design consists of three screens (home page, student performance, course materials).
Conclusions
Learning analytics dashboards could provide teachers with additional insights into the learning process of students. Teachers preferred features and indicators related to the results of students and the comprehensibility of the course content. There is a need for well-designed dashboards, including more detailed indicators about the performance of students and the comprehensibility of the course content. The design in this thesis is a useful first step.
The full thesis can be downloaded here: Towards effective learning analytics for higher education: returning meaningful dashboards to teachers
Dr. Sieuwert van Otterloo is a court-certified IT expert with interests in agile, security, software research and IT-contracts. He is a also an ISO 27001 and NEN 7510 auditor and AI researcher.