
Legocolor: a computer vision dataset for learning datascience
| Sieuwert van Otterloo |
Artificial Intelligence
Research

The Legocolor dataset is a new dataset designed to test common data science techniques such as k-nearest neighbour and decision trees. The dataset consists of color samples (red, green and blue value) from real world images of Lego and the official lego color of the brick, and the goal is to train a model to determine the right color out of 14 possible colors. The dataset is unique in its simplicity (only 3 inputs) and non-linearity (14 possible outcomes with only 3 inputs). This makes it very suitable for learning complex patterns.
The color classification problem
The Legocolor dataset was created by Rosalie Fischer for her Bachelor thesis at the Vrije Universiteit. The dataset was designed with the following requirements:
- The dataset must be linked to a classification problem.
- Unlike existing datasets, the problem should have only a few inputs with identical impact on the final result.
- The problem should not be a yes/no classification, but a problem with multiple labels.
- The dataset must be based on a real world problem and use real data.
- The dataset should not contain personal data, so that it can be used without privacy risks or ethical risks.
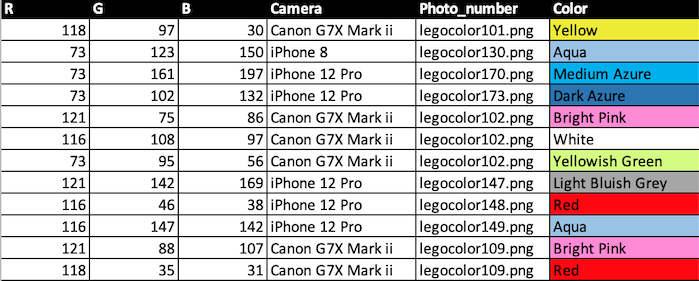
The task chosen for this dataset is color recognition: Given the color values from an image, determine the color of a lego block. The table below shows a fragment of the full dataset. Each line in the table contains the red, green and blue value taken from a photo. In the rightmost column, the official name of the color of the lego brick is given. The task is to determine this color.
How the dataset was created
The Legocolor dataset was created by taking multiple pictures of the same lego setup. Lego was chosen so that other researchers can recreate the results and extend the dataset if needed. Anyone can order the required lego sets, build the same setup and make additional photos. The Lego setup was photographed in different locations, with different cameras and different lighting conditions. Below are four different photos that show some of the different conditions. Note that only the lighting conditions are different. The object itself is always the same.
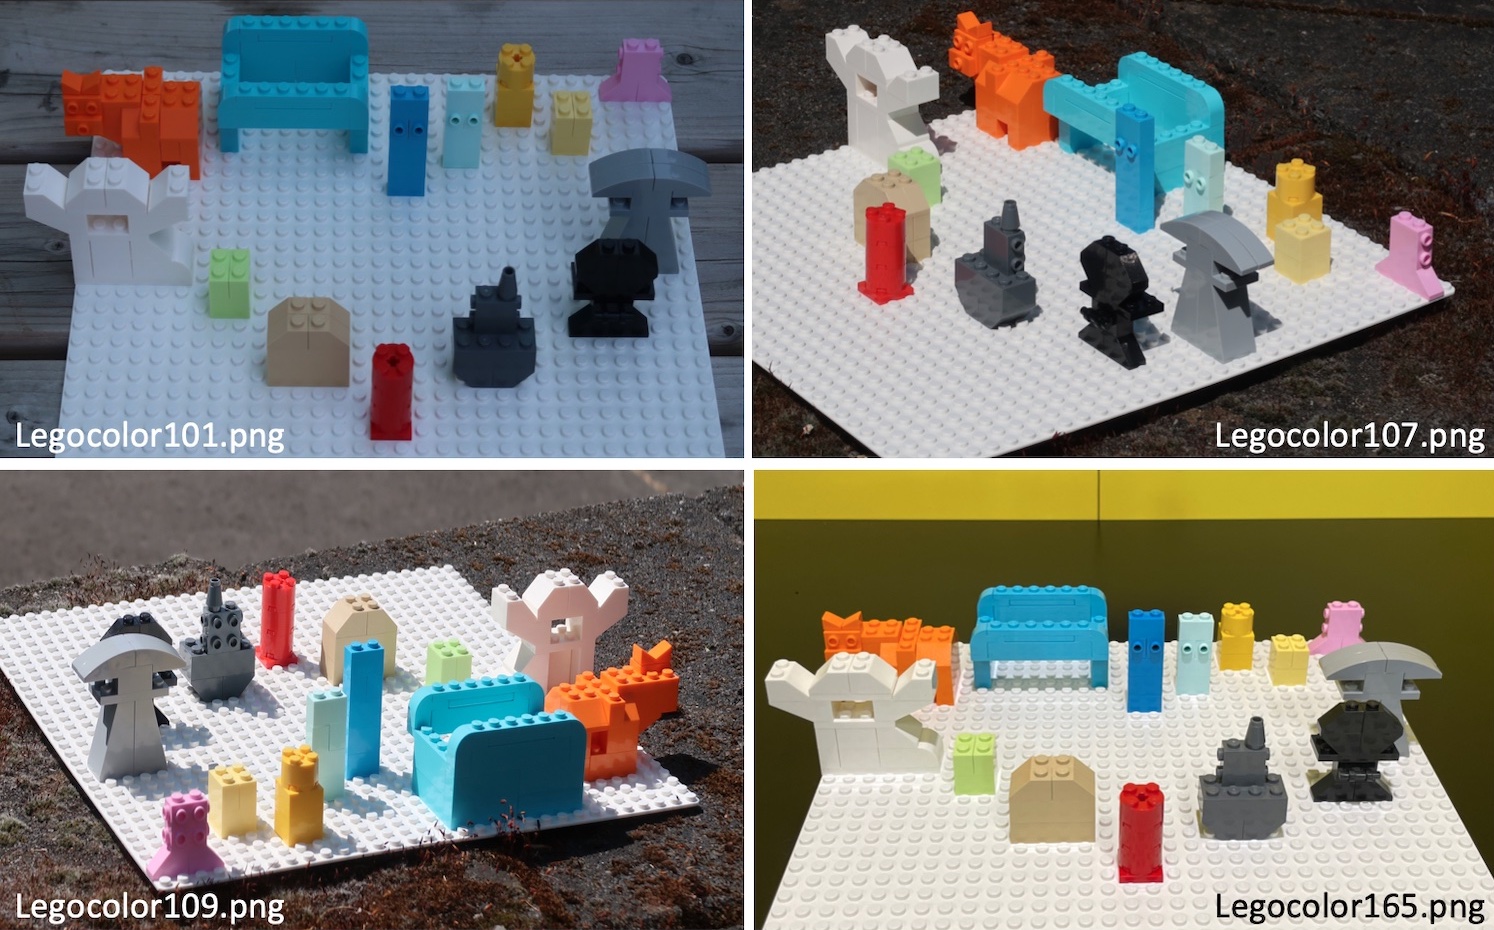
After creating the photos, two samples per object were created by selecting x and y coordinates, recording the red,green and blue values and the color of the object. There are 14 objects in the photo, each in a different lego color. Note that some of the colors are very different and should be easy to distinguish. Other objects have similar colors (gray and black or the multiple blue objects). There are 88 photos in the dataset, the first photo is called Legocolor101.png.
Why color classification is an interesting problem
Color classification is interesting because it is a real world problem, and it is difficult. C0lor classification is a subtask in computer vision and robotics: recognising an object by its color is often used in robot navigation. There are robot football leagues where the two goals and the ball have different colors and the robots must recognize goals, the ball and other robots based on color.
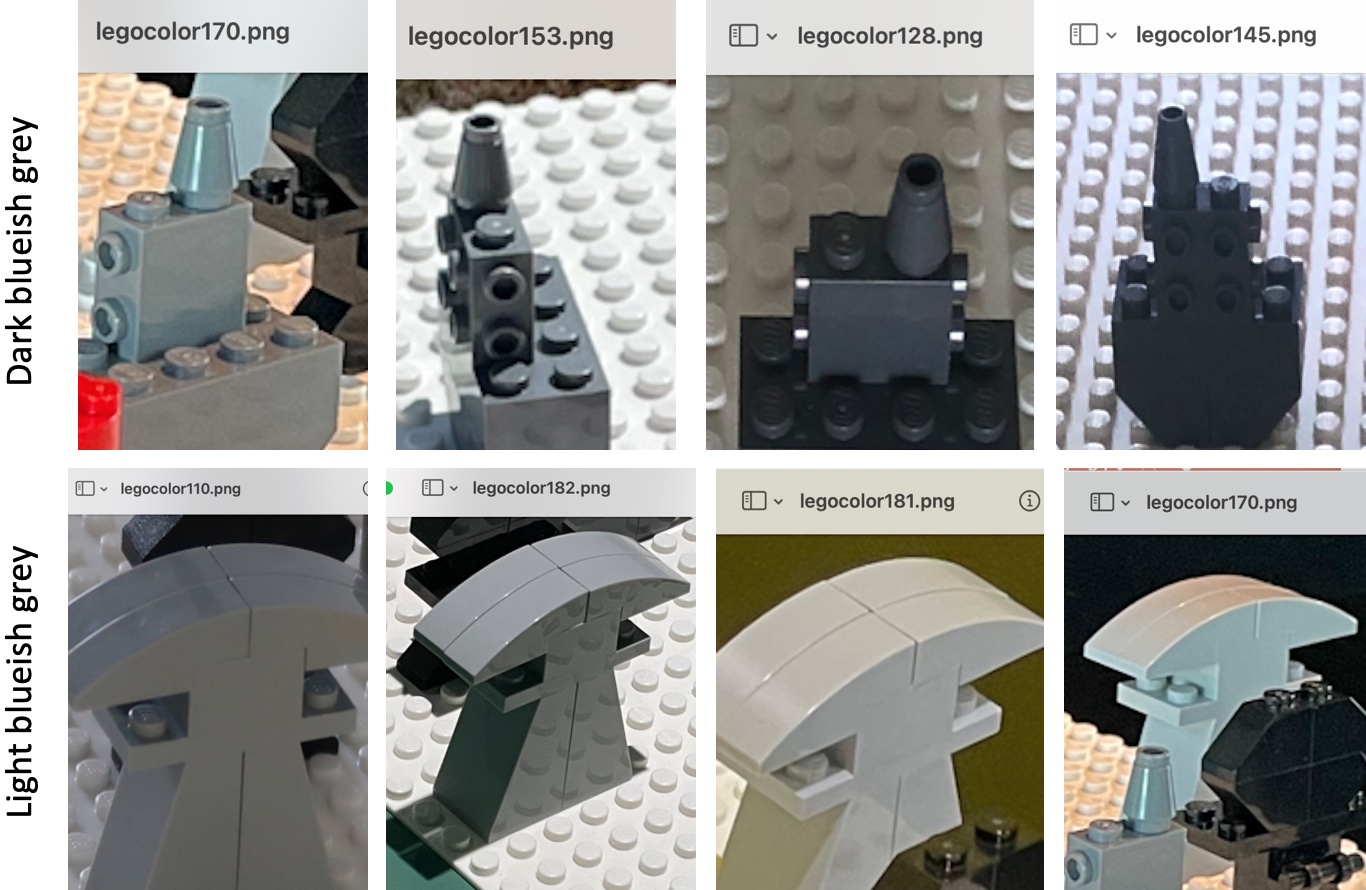
Humans are generally good at sorting lego by color, son one would expect that color classification is an easy task. Unformtunately, it is surprisingly difficult The same object will appear to have different colors depending on the lighting conditions. The human eye and brain are good compensate for the lighting conditions automatically, so most people are quite good at this task. Electronic cameras are not so good at this, and computers and robots thus often make mistakes. The example shown below shows that the same lego object can register as light grey or dark grey depending on the circumstance. It will be hard to classify these two colors correctly in all photos.
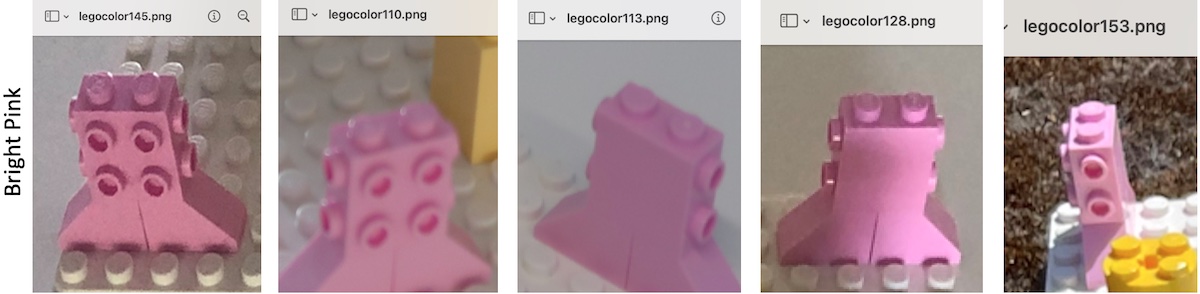
Even with with very distinct colors, there is a lot of variance. One of the easiest colors to recognize for humans is bright pink. The example shown below shows that the pink object is also registered differently.
Why you should use this dataset
This dataset is part of a small family of datasets that complement each other. The Utrecht housing dataset can be used to show regression and is designed so that one can use both linear regression, clustering and more advanced techniques such as neural networks. The Utrecht Fairness Recruitment Dataset is a dataset that can be used measure fairness and bias. These datasets both have many independent inputs, and thus favour certain methods: they work will with linear / logistic regression and are not well-suited for many other valuable techniques. Techniques such as nearest neighbour, Support Vector Machines, but also multilayer neural networks can be evaluated and analysed using the Legocolor dataset but not with many other datasets.
Downloading the dataset
You can download the following items:
- The basic dataset. This is a CSV file legocolor-basic.csv that contains the raw data in its simplest form, as shown above. It contains rows corresponding to a specific pixel in a photo. The CSV file contains red, green, blue value, photo name, location (x,y) and the official lego color name.
- The extended dataset. This is a CSV file legocolor-extended. This dataset contains the same datapoints but additional columns that are the result of preprocessing. You can use this dataset if you think this additional preprocessing is useful. The additional data is the Hue, Saturation and Brightness of te color (derived from the red, green and blue values) and the YUV values (brightness, green vs red shift, red vs blue shift).
- The complete dataset “legocolor-dataset-complete“. You can use these images to analyse interesting false positives or false negatives or for illustrating your results.
- An excel file legocolor-dataset-extended. The excelfile contains the same data as the extended dataset but with nicer colors and a filter.
Questions to solve for this dataset
If you are interested in learning data science using this dataset, we suggest you try the following with the basic dataset.
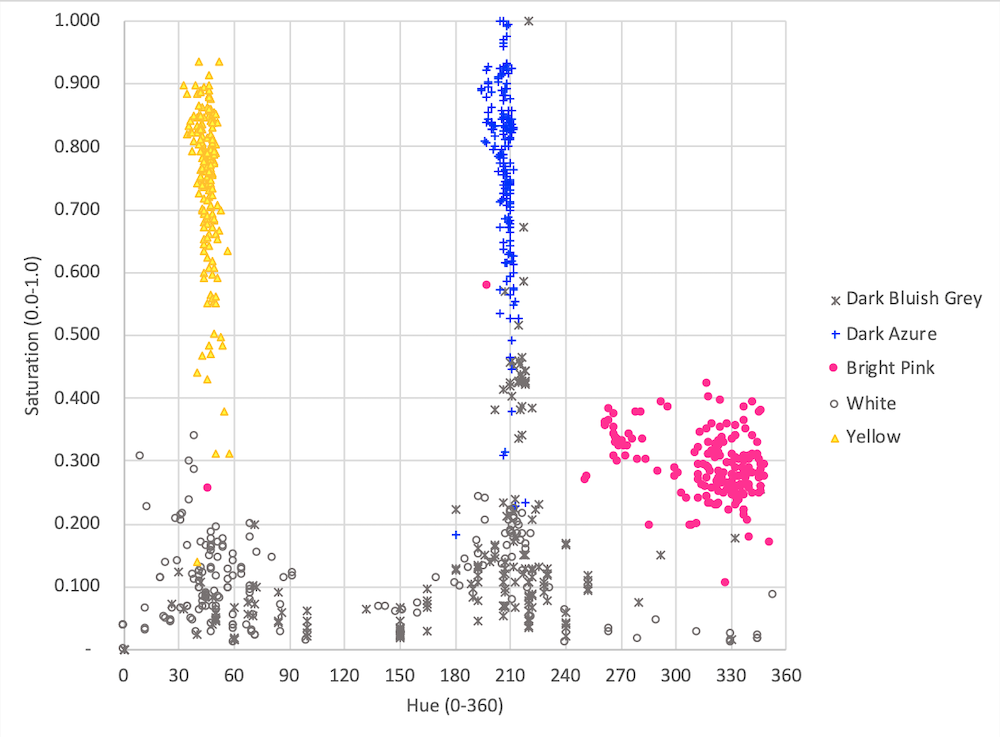
- Create scatterplots to understand how variables can be used to distinguish colors, what colors are hard to distinguish, and to prove that it is not possible to get perfect results, Below is an example scatterplot using Hue and Saturation and five different colors.
- Try to compute the average values and variance for each color. Using these numbers, determine the distance between each color and what colors are most likely to be mixed up.
- Build a classifier for the classification problem. Split the data into train and test data, train the classifier using the train data and test using the test data. If the results are disappointing, try to create simpler subproblems by leaving out colors. In your report, list what hyperparameters you tried and what the optimal hyperparameters are,
- Once you have a good classifier, determine which color is the hardest to detect.
- Once you have a good classifier, which camera makes the best and worst photos and in which photos you have multiple mistakes. Try to explain what causes the mistakes: e.g. photos are blurred, dark, out-of-focus, etc.
- Build multiple classifiers using different techniques and explain what the best result is for each classifier and thus which classifier is the best for this problem.
Extended dataset explained
 There is a lot of theory about color perception, and there are multiple ways of representing colors. The following are four common ways to represent colors. These are also called color-spaces:
- Using the red, green and blue value. Any color that can be displayed on a screen can be represented by the amount of red, green and red light. This is the way cameras register color and also how color displays work. The color black is represented by (0,0,0), red by (255,0,0), yellow by (255,255,0) and white by (255,255,255).
- Using Cyan, Magenta, Yellow and blacK (CMYK). This is the way colors are represented in print, by mixing four different inks.
- Using Hue, Saturation and Brightness (HSB). The Hue value indicates the type of color on a color wheel, the saturation the amount of color and the brightness the amount of light. This is an alternative, more inuitive way to represent colors.
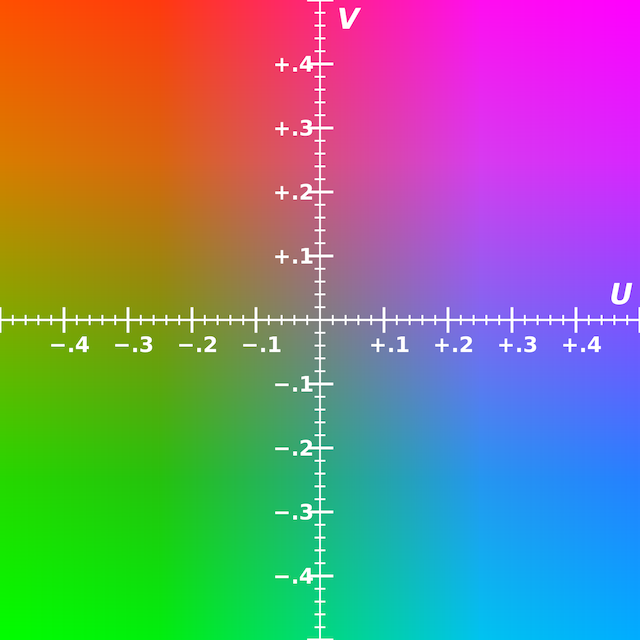
- Using the YUV color space. This is a way to represent color images designed for TV signals that works for early black and white TVs and later color TVs. The Y-value represents brightness (average of red, green, blue). U represents the shift towards red/purple and V represents a shift towards blue. The image on the right shows the effect of U and V (source wikipedia).
We have added the HSB and YUV values in the extended dataset, as an example of how preprocessing can be used to boost the performance of machine learning algorithms. In theory, no information is added with these columns since the HSB and YUV values can be computed from the RGB values. A sufficiently large neural network could compute these values. In practice, many methods will perform better if they can use these additional inputs. We invite you to try out different algorithms such as logistic regression and decision trees with these additional inputs.
You can try to build multiple classifiers using the same modelling techniques (e.g. neural networks) but with and without the additional columns in the extended dataset. Comment on whether the preprocessing is helpful in different circumstances. For instance whether you can use fewer layers in neural networks if you use the additional columns. In theory the preprocessing is unnecessary but in practice it should give better results faster.
The final elements of the extended data set is the average value of the entire image. The idea is that sometimes colors are hard to classify because the entire image is dark, bright or has a blue glow. Having the average value for the entire image should help the algorithms discover the lighting conditions of the image, and should help the algorithms do a color correction. We would like to hear from you whether using these values does give better results.
Dr. Sieuwert van Otterloo is a court-certified IT expert with interests in agile, security, software research and IT-contracts. He is a also an ISO 27001 and NEN 7510 auditor and AI researcher.