
The Utrecht housing dataset – example dataset for prediction
| Sieuwert van Otterloo |
Artificial Intelligence
Research

The Utrecht housing dataset is a freely available dataset that can be used by students to learn about data science and machine learning. It is suitable for multiple techniques, including decision trees, linear regression, logistic regression and neural networks. Note: the dataset was updated in 2025, see a detailed description of the latest 2025 version here.
About the AI and Machine learning summerschool
 In July 2022, 2023 and 2024, Stefan Leijnen and Sieuwert van Otterloo taught a one week summerschool ‘AI and machine learning’ at the Utrecht University of Applied Sciences. Each year it was a very successful event, in number of participants and in terms of content. 35 students from all over the world attended and worked together in different groups. The summer school ended with research presentations and a Kaggle-style data competition. The goal of this summer school is to make AI and Machine Learning accessible to as many people as possible. Using AI without properly understanding it comes with risks. We want to reduce these risks by giving students from all backgrounds the tools and knowledge to understand AI. Luckily, AI has become more accessible thanks to the existence of many free and open tools and libraries. Any student can train and test algorithms with only a few days of training.
The 2022 editions is similar to the 2021 summerschool on AI and Machine learning, and even the 2022 webinar on this topic, but with some improvements. The summerschool has a five day structure with a clear goal for each day:
- On day 1, students become familiar with the tools of data science: Python and Julpyter notebook. We practice looking at and understanding individual data points
- On day 2, students build models and make predictions using linear regression and decision trees. These ‘simple’ models have fewer risks and alredy give good results on well structured data.
- On day 3, students experiment with training neural networks. They learn why training is needed, why training is complicated and why the same code will behave differently with different data
- On day 4, they learn to use neural networks on differently-shaped data, most notably images. We are using the MNIST hand writing dataset to develop neural networks that can recognize digits.
- On day 5, we look at evolutionary algorithms to get a better understanding of how neural networks are trained.
In addition to these core modules, several guest lecturers presented additional material that shows additional uses and also research challenges in AI. The topics discussed are:
- History of AI and neural networks
- The use of AI to generate music and the AI song festival
- The use of data science to analyse business processes and do business process mining
- Text to speech generation using crAIyon
- Research into ethical AI and responsible AI
The Utrecht Housing Dataset was designed for use during day 1, day 2 and day 3. The dataset has multiple different input variables that are interesting to explore. The size is such that it is well suited for interesting visualisations. The dataset represents one of the core tenets of responsible AI: AI should be made accessible to a wide group of people, so that anyone with some university experience can test and evaluate algorithms.
Why use the Utrecht Housing dataset
When developing the summerschool, we could not find a dataset that was both interesting to analyse and easy to use. Existing datasets often have data quality issues that distract from the learning goals, or are only suited for illustrating one phenomenon. Many classical machine learning datasets also do not have meaningful tasks. The problems that one can do with these datasets are either too basic or theoretical. The Utrecht Housing Dataset thus offers a new combination that we found useful in our classroom:
- It has multiple different input values (11 inn total) that can be combined in interesting ways
- It has four different ‘output values’ or target values so that it can be used for different challenges.
- It does not have any conversion problems, data quality issues or missing values.
- It does not have any privacy risks or violations.
- It corresponds to a well known, important real world problem
Getting the Utrecht Housing dataset
The dataset can be downloaded via Kaggle here. In the earlier versions, are three different files, with different sizes. The small dataset is most useful for visualisation. The large and huge datasets are useful for training and testing models. You can also download the 2024 dataset via these links:
- small: https://ictinstitute.nl/wp-content/uploads/2024/07/utrechthousingsmall.csv
- large: https://ictinstitute.nl/wp-content/uploads/2024/07/utrechthousinglarge.csv
- huge: https://ictinstitute.nl/wp-content/uploads/2024/07/utrechthousinghuge.csv
The 2025 version is smaller but based on real data, you can find this version here. The dataset is released as creative commons, and can be used freely for any purpose. If you use it, please refer to it as the “The Utrecht housing dataset – example dataset for prediction” by Sieuwert van Otterloo, www.ictinstitute.nl or refer to Sieuwert van Otterloo as the author/source.
Introduction to the data set
 Many people are interested in living in the city of Utrecht. To do so, one needs to either rent or buy a house. Buying a house is recommended when you plan to live in Utrecht for five or more years: it allows you do fully customize your house to your own liking. The housing market is fairly transparent. There is a website (funda) with all houses on the market, including key characteristics. Many people have bought and sold houses, so there is a common understanding of what drives the value of a house: it is a combination of the size of the house, it’s location, amenities such as bathrooms and balconies and location.
Each house has two values: an official ‘tax value’ that is used by the city of Utrecht to detrmine how much property you will pay, and a retailvalue that is the fair price to buy the house. estimating the retail value is the ‘golden problem’ that everyone tries to solve. Real estate agents need to estimate the value to help their clients, and people decide what to bid based on their view on the retail value.
Certain rules of thumb exists (e.g. you should bid 3000 euros per square meter, newer houses are worth more, houses with more land are worth more, houses near the city center are worth more). These rules are however not foolproof. You as a researcher should use dataset to find and test these rules and learn how to use all data to make accurate estimations.
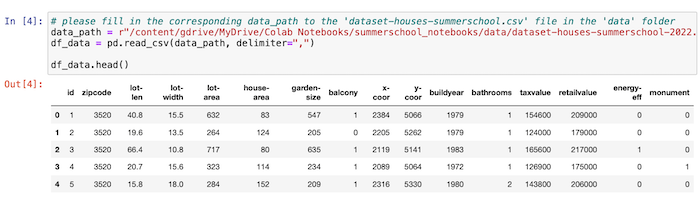
The dataset is provided as a CSV file. Each line contains data for one house. The values are seperated by commas. An example line is the following:
- 9005, 3520, 44.2, 18.1 ,800, 160, 750, 0, 2138, 5110, 1978, 2, 226000, 286000, 0, 0
The order of elements is id,zipcode,lot-len,lot-width,lot-area,house-area,garden-size,balcony,x-coor,y-coor,buildyear,bathrooms,taxvalue,retailvalue,energy-eff,monument.
The meaning of each column is as follows:
- id: a number between 0 and 100000 that is a unique identifier for each house. Do not use this in your algorithms
- zipcode: Each house has a zipcode corresponding to the area the house is in. The zipcode can be an indicator of build year or other properties. There are four different zip codes in use: 3520, 3525, 3525, 3800.
- lot-len: the length in meters of the plot of land the house is built on. Each house is built on a square plot of land. It can be anything from 5.0 to 100.0 meters
- lot-width: the width in meters of the plot of land the house is built on. It can be anything from 5.0 to 100.0 meters
- lot-area: the total area of the plot of land the house is built on. You can probably compute this from lot-len and lot-width.
- house-area. The living area of the house in square meters. 30.0 square meters is a tiny house, 200.0 square meters would be a mansion.
- garden-size: The size of the garden in square meters. Many people want to have a large garden.
- balcony: the number of balconies the house has. Common values are 0,1, or 3 balconies
- x-coor: the x-coordinate describing the location of the house. It is an integer value between 2000 and 3000
- y-coor: the y-coordinate describing the location of the house. It is an integer value between 5000 and 6000
- buildyear. The year that the house was built. Some of the oldest houses are from 1100,, but most houses were built in the 2oth and 21st century.
- bathrooms: Most houses in Utrecht have one bathroom. Some houses have 2 or 3 bathrooms
- taxvalue: The taxvalue of the house is a number between 50.000 and 1.000.000 that is a conservative value of the house. It is estimated (often based on real housing data) by the government to determine taxes. In a calm market, it is close to but often slightly lower than the retail value. It is rounded to the nearest 100 euros.
- retailvalue: the market value of a house. It is a number between 50.000 and 1.000.000. It is rounded to the nearest 1000 euros.
- energy-eff: This value is either 0 or 1. If it is 1 it means that the house is energy efficient. This is important for certain climate goals of the city of Utrecht
- monument: Some houses in Utrecht, especially older houses, have monumental value since they have a unique architectural design. People have been trying to predict if this is the case from other data, since it is timeconsuming to visit each house and inspect the architecture.
Below is the dataset shown as it is displayed in Jupyter notebook.
Example code
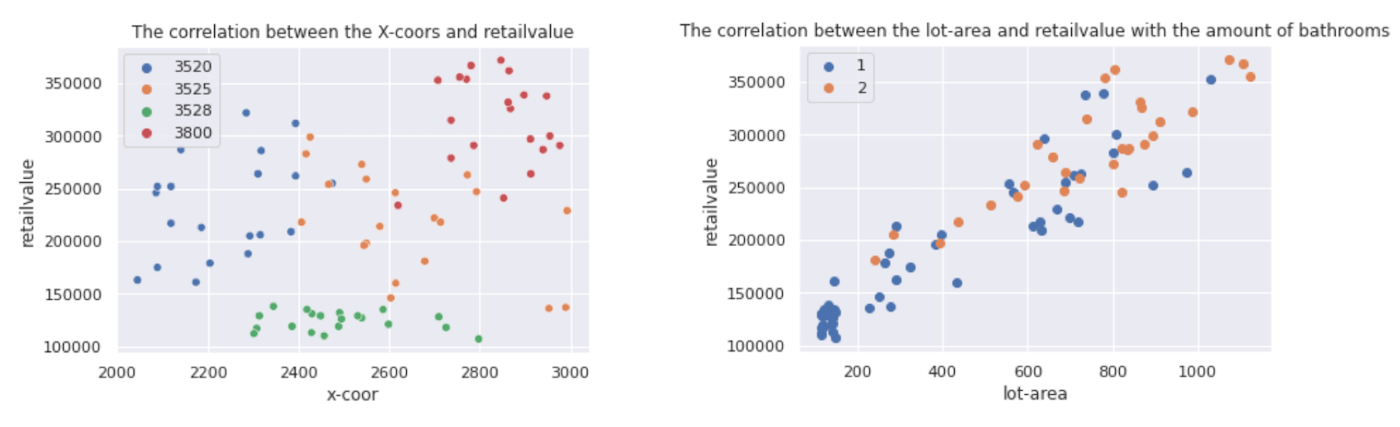
The following zip file contains example notebooks to make basic charts on this dataset. Below are some scatter plots that show relations that are present in the data. We encourage the use of scatter plots since they show patterns as well as exceptions. These scatter plots show that retailvalue can be prediced and that the input from multiple variables should be combined.
The notebooks contain questions and example answers (courtesy or Maria Dukmak and Stan Meyberg). You will learn most if you try the questions before looking at the answers.
Suggested exercises
The following tasks are interesting tasks for students:
- Compute the correlation between different variables: e.g. are house-area and retailvalue related? Are x-coor and retailvalue related?
- Create a scatterplot of different variables, e.g. x-coor and buildyear. Describe the relation you found.
- Can you predict taxvalue form house-area and gardensize? How good is your prediction?
- Do your predictions improve when you treat each zipcode seperately? What is the average value / per square meter in each zipcode?
- Can you determine the city center and compute distance to city center? Is there a relation between value and distance to city center?
- Can you normalize the house area using a standard function? What real world house area does a normalized value of 1.0 correspond to?
During the summer school we invited students to create models using only 3 or 4 input values. It was their job to select the most promising input values and a technique (linear regression, decision trees, neural networks). The students should split their data into a training test and test set are check both training set accuracy and test set accuracy.
Cover image: denise-jans. via unsplash
Dr. Sieuwert van Otterloo is a court-certified IT expert with interests in agile, security, software research and IT-contracts. He is a also an ISO 27001 and NEN 7510 auditor and AI researcher.