
Financial project analysis with NPV
| Sieuwert van Otterloo |
Project Management
Reducing a software project to a financial number like NPV and IRR might seem like a shallow way to look at a project, and thus not agile. It turns out however that such a financial analysis can be very helpful to find out what a project really is about. This year we added portfolio management and project management to our software project management course. In this blogpost we explain how to do this using two key numbers: the net present value (NPV) and the internal rate of return.
Why do financial analysis?
When we started teaching software project management in 2016, we deliberately decided not to include financial analysis. Making predictions is hard (especially about the future) and future benefit predictions in project plans are often wrong. This year however we changed our mind. We still believe the outcomes will not be completely accurate. We do think that doing the analysis is useful nevertheless.
We noticed in practical projects that doing a financial analysis will give everyone involved a better understanding of what the project is about, and leads to better scoped and managed project. Our new recommendation is therefore that every project leader should do financial analysis at the beginning of the project.
The first reason for doing financial analysis is that people often spend too much time focusing on the cost of software projects, but not on maximizing the benefits. For instance many software projects deliver a new system B that should replace an old system A. Many technical project managers focus too much on getting system B up and running. Once this system is up and running however you have two systems and double maintenance costs. The benefits only start if one switches of system A and can stop doing maintenance and terminate the contracts for system A. Doing financial analysis should make this clear to the project team so that they can put more emphasis on these money making steps.
Defining project end
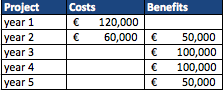 The second reason for doing financial analysis has to do with project scope and project end. Many software projects have a build phase where you make costs, followed by an earning phase where the delivered system generates revenue of saves costs. Take for instance project X, whose numbers are listed here. This project has a two year build phase, followed by a three year earn phase. Software project management books will typically treat this as a two year project: there is a detailed plan and a dedicated team for the first two years, but the last three years are basically unmanaged and left to the client. A financial analysis clearly shows that this is in fact a five year project. There is a lot of money to be made by doing good management on the last three years as well. Note that the client would typically agree with the financial analyst: for him or her this is also a five year project.
How to do financial analysis: modelling cash flow
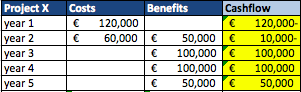 In order to compute financial metrics, one needs a financial model. This model is simply an overview of cash flows of the project over time. Below we have made the simplest model possible from our project X by Adding negative costs and positive benefits. You see a single column of cash flow. For most projects and also businesses, the cash is initially negative but becomes positive later on (year three in our case).
For software project management, we believe a yearly model is not accurate enough. Good financial analysis means that you should take care when exactly value is created. We therefore insist on making monthly models. This forces you to challenge the initial assumptions and will result in a better understanding of the project.
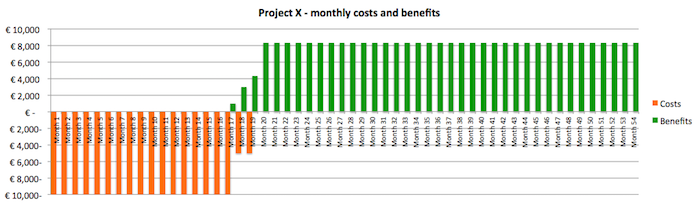
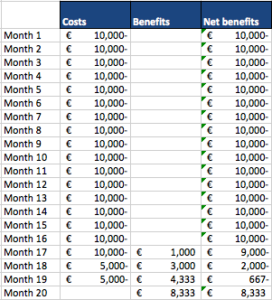
Above is the monthly financial overview of project X. As you can see the cost are mostly fixed cost per month, followed by fixed benefits per month. Fixed monthly costs is very typical for software projects when you work with a stable team. To compute all financial ratios, you need a table of cash flows. Below you see a fragment of this table. It has the same structure as the annual table.
Metric one: cost benefit ratio
The first metric one should compute is the cost benefit ratio. This is a very basic metric since it does not take into account the time value of money. It is however good to compute this first as a consistency check. If this metric is not good, it makes no sense to compute the other metrics. To compute the cost benefit ratio, divide the total benefits (300.000 euros) by the total cost (180.000 euros). The ratio is 1.67 for this project. Any ratio above 1 is normal. It is a ratio, so any number higher than 20 is probably wrong.
Metric two: Net benefits
The problem with the cost benefit ratio is that does not show the size of the projects. You can have two projects with the same cost benefit ratio, and one project could deliver thousand euros and the other one a million. For this reason it is good to also look at a euro-based metric. The simplest euro based metric is the net benefits. One computes these by adding up all benefits (300.000 euros) and subtracting all costs (180.000 euros). The net benefits are thus 120.000 euros.
Metric 3: Net present value
 If you have made a monthly cost and benefit table and checked the cost benefits ratio, you are ready to compute the net present value or NPV. The procedure is as follows:
- Determine net benefits for each month (or week, or year)
- Determine discount factor for each month (or week, or year)
- Compute present value for each time period by dividing the net benefits by the discount factor
- Add up all the present values of each time period to obtain the net present value.
NPV is basically the same as net benefits, except that it takes the time value of money into account. A euro now is basically worth more than a euro tomorrow or next week. The time value consists of two values: normal interest that you would get on a risk free savings account or on a government bond (A), and a risk premium if the project has some risk (B). In the past, factor A was already 4-6% so you could also use this interest rate as a discount factor. In 2017 we have a unique situation where factor A is near 0%. You cannot use 0% as a discount factor however because projects typically have risks. Companies want a premium on their money when investing in an IT project. In our example we will work with an annual discount rate of 5%, a typical rate. Any other rate between 2% and 20% could also work.
The annual rate must be converted into an annual factor first (divide by 100 to get rid of percentage and add 1) so we will use discount factor 1.05. One should then convert the factor to a monthly factor to use it in a monthly model. The formula is mf = af ^ (1/12). We have converted a few common percentages is the table on the side.
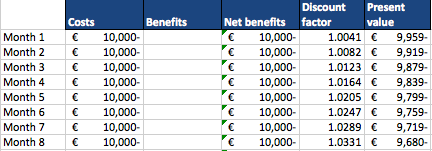
The discount factor is applied each month, so the cash flow from each month is valued less and less. We have added two columns to the costs and benefits table. One shows the discount factor for that month, the other one the present value of that months cash flow (computed by dividing net benefits by discount factor). As you can see the present value is always closer to zero than the absolute value.
You get the net present value by adding up all present values. For project X it is 85600 euros.
Using net present value correctly
The net present value (NPV) tells you what the total value is that the project will bring. You should use for decision making about whether a project is worth doing:
- If the value is negative, the project is not worth doing at all, or at least the value is not clear. You should not start the project, but first investigate why the cost are so high and whether you might have missed some benefits in the model.
- If the value is positive but low (e.g. hundreds of euros) you should also stop and reconsider the project. The project is probably not worth the management time and a small setback could wipe out the value.
- If the value is high, continue with the project and see what you can do to improve the NPV further.
If you have a portfolio of projects and project ideas, you can use the NPV to rank the projects from most valuable to least valuable. When doing so, note that NPV favours big projects. This is OK for discussion purposes (big expensive projects should be discussed for longer) but you might want to do a small project with a high cost benefit ratio instead of a project with high NPV but huge costs. For any portfolio decision workshop, we recommend computing NPV and another metric such as cost benefit ration and IRR to have multiple perspectives on each project.
Financial analysis and agile project management
At ICT Institute we prefer agile project management over non-agile project management. The agile principles are very helpful in avoiding common IT risks. We also like financial analysis, as long as it is done in such a way that it does not clash with agile values. To put it simply:
- Do not spend too many days on making a very precise financial model. Any estimate made in the beginning of the project is only vaguely right. Adjust the model along the way if needed
- Keep it transparent: make one simple financial model and share this will all stakeholders. Make useful assumptions such as fixed monthly costs to simplify the model
- The real world is dynamic, so do not plan too far into the future. If your software project has an earn phase of more than 5 years, it is probably not worth doing.
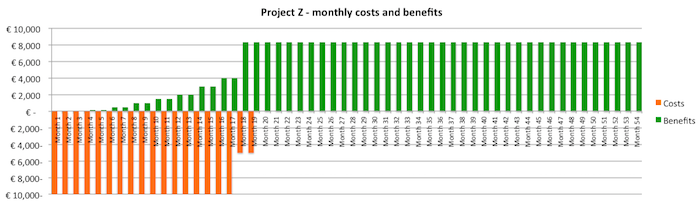
Using financial analysis is actually helpful in understanding why agile project management is good business. As you can see from the financial model, the build phase and earn phase of project X are almost completely separate. The financial model shows that we invest a lot of money in building software in year one, that is not used until year two. This is a waste and it would be much better to deliver the project gradually. If you can deliver working software every two months, one would get the benefits much earlier. Below we have listed project Z, the same as project X but with delivery in iterations. If you do this right, the build phase and cost stay much the same, but the benefits build up gradually.
The effect on the NPV is rather striking. We have been conservative and assumed the benefits start small, starting at 100 and 500 euros. Because of the time value of money effect, the impact on the net present value is large: the NPV is 36% better (112.000 euros).
Financial analysis and agile project management
Financial models are also useful in project risk management. In a previous posts we already talked about identifying risks, and estimating likelihood and impact. Many risks result in a delay. One can use the financial model to estimate the impact of any delay. The model will not only tell you what an extra month building will cost, but also what the effect on the net present value is of a delayed launch.
Metric four: IRR
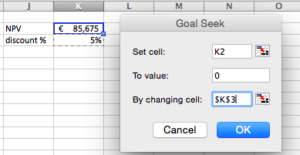 The Internal rate of return or IRR (IRR on wikipedia) is another project metric. It is similar to but slightly more complicated than the NPV. As you probably recall, you need to make an assumption about discount factor in order to compute an NPV. Healthy projects will have a positive NPV when using a normal discount factor (e.g. 5% per year). The NPV gets worse if you assume a higher discount rate, because most projects have upfront costs and postponed benefits. If you make the discount rate high enough (think 20%, 50%, 100% or even 200%) the NPV typically turns negative. You can try this out if you have a financial model. For each project there should be a discount rate where the NPV is exactly zero. This is the internal rate of return. The internal rate of return is thus a percentage. In our model, we used the excel function ‘goal seek’ to compute the IRR of project X. It is 26%.
Further reading
For more info on NPV and IRR specifically, check out this NPV blog post, or NPV video from educationUnlocked or this one from collegeFinance.
This article is part of a series that accompanies the university course on software project management by Joost Schalken, Jeroen Arnoldus and Sieuwert van Otterloo. The series consists of (1) creating a vision, (2) project scope, (3) managing non-fuctional requirements, (4) effort estimation, (5) planning and scheduling, (6) organisational change, (7) risk management, (8) Privacy Impact Analysis, (9) Financial project metrics and (10) recommended project management books and articles.
Image credit: Fabian Blank via unsplash
Dr. Sieuwert van Otterloo is a court-certified IT expert with interests in agile, security, software research and IT-contracts. He is a also an ISO 27001 and NEN 7510 auditor and AI researcher.